JA Finance Module Introduction
Quick Info
- Updated on:02 Jul, 2024
- Version:1.2.1 Changelog
- Download:2,556
JA Finance Joomla module integrates TradingView to help admin build from basic to advanced charts for any market, stock, asset currency, cryptocurrency value in real-time with rich trading indicators, volume, RSI, Ichimoku cloud, Bollinger Bands, Moving Averages and more.
Main features:
- Multiple chart types: Market overview, Ticker, Ticker tape, Single Ticker, Mini Chart, Symbol Overview and Cryptocurrency Market
- Preview on Back-end: preview the chart directly on back-end
- Auto complete Symbol Search: easy to search for Symbol
- Real-time information and market insights:
- Fully responsive: present data beautifully in responsive layouts
- Easy to setup: friendly admin panel with features built-in as options for easy configuration
Main Features
Integates TradingView
TradingView has all charting tools you need to share and view trading ideas. Real-time data and browser-based charts let you do your research from anywhere. JA Finance integrates TradingView to help you build charts for any market, stock, asset currency, cryptocurrency and display on any place in your website.
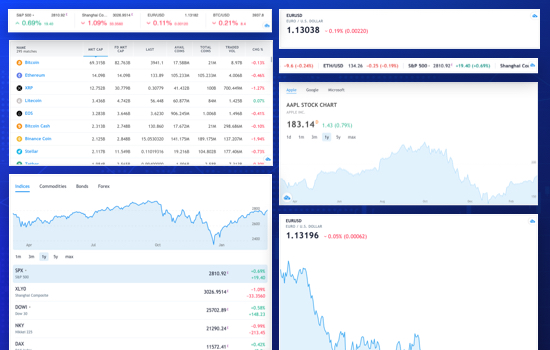
Support multiple chart types
JA Finance supports 7 chart types to show real-time stock, market insight, asset currency in different views.
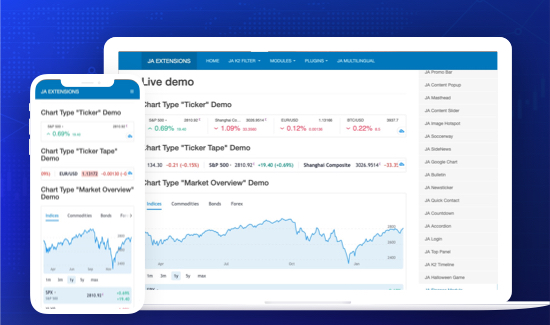
Fully responsive design
The charts you build are responsive at core, they are auto resized to fit responsive layouts and displayed beautifully in the layouts.
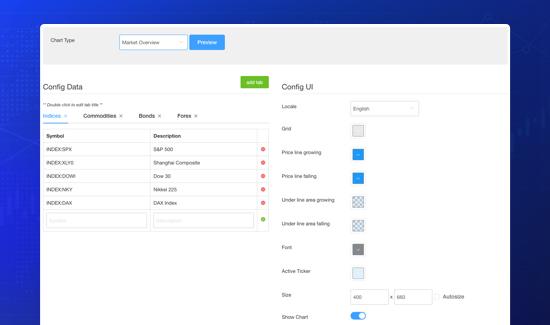
Friendly admin dashboard
The module admin panel is so easy to setup and configure in some simple steps: select chart type, setup data and configure UI if you want since the default UI looks good already.
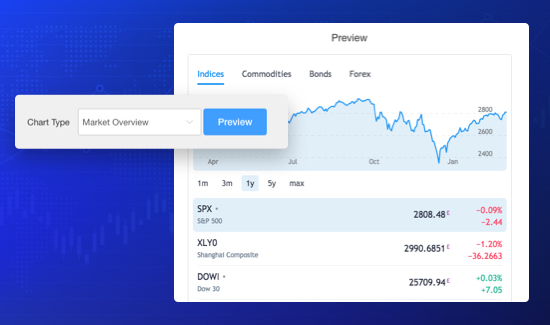
Preview charts on back-end
When setup the chart, you can quickly preview how the chart looks with the built-in preview function on back-end.
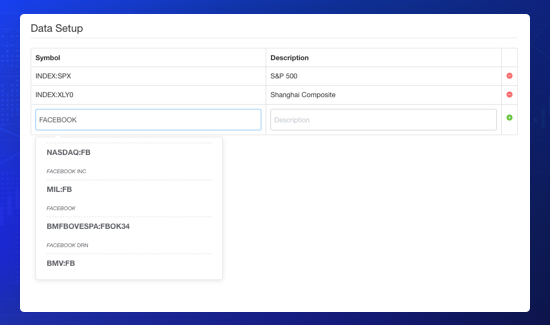
Auto Complete Symbol search
Add Symbol is very easy with the built-in auto complete Symbol search, type the company name and it will show relevant search results, select a name and it will add the company Symbol.
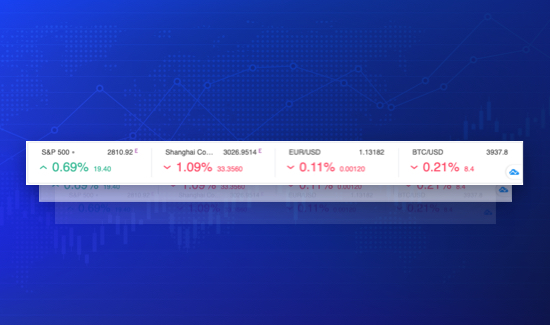
Supports Ticker Chart
Ticker Widget is a horizontal quick-glance bar with instrument prices. You can display up to 15 different symbols with their latest price and daily change.
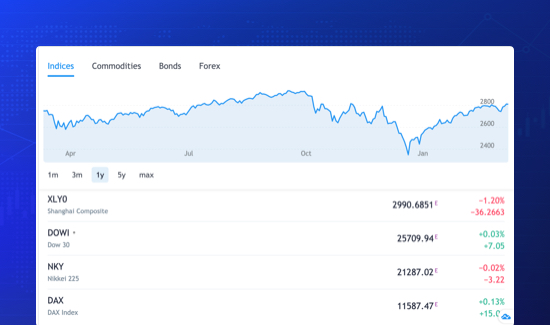
Supports Market Overview Chart
Market Overview Widget provides a quick glance at the latest market activity across various sectors. It works great for homepages, and it can be configured to take users to a page with a larger chart on your site. Set your own instrument lists and tabs to cover what you need, adjust the timeframe for the chart or even hide the chart completely.
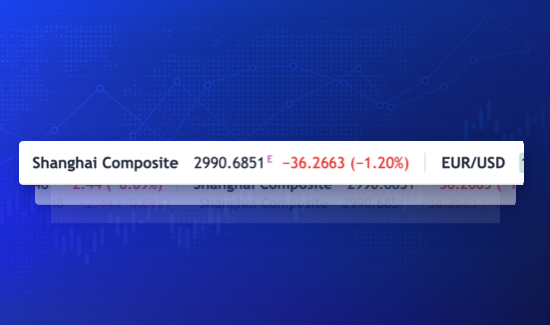
Supports Ticker Tape Chart
Our classic Ticker Tape Widget is intended to make it simple to add the look and feel of Wall Street to websites. Start displaying stock exchange-style running ticker symbols in just a few clicks!
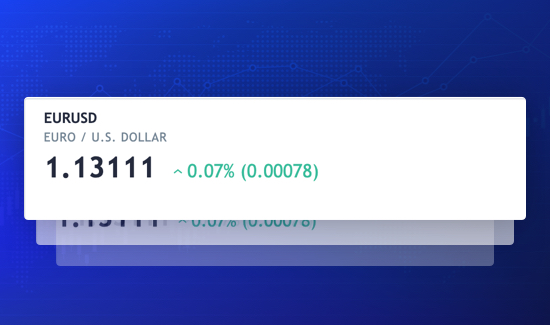
Supports Single Ticker Chart
Single Ticker Widget displays the price and change percentage of your preferred symbol. This little yet powerful widget is great for seeing the latest price update.
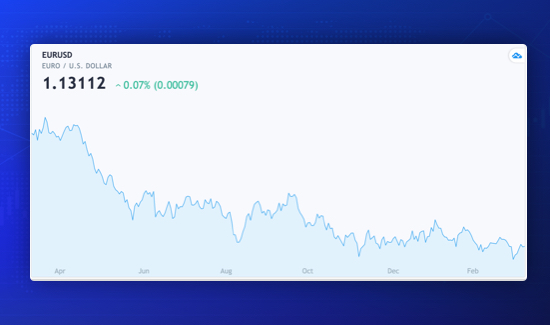
Supports Mini Chart
Mini Chart Widget displays the price, change percentage along with a basic chart of your selected symbol. Pick your symbol and customize the date range in just a few clicks.
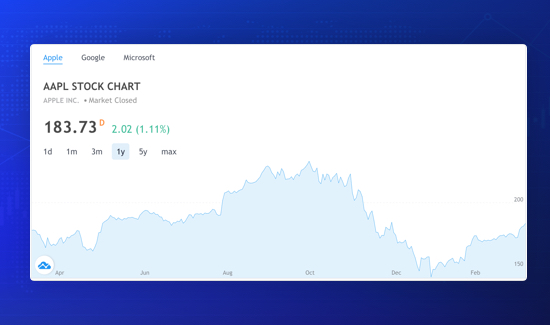
Supports Symbol Overview Chart
Symbol Overview Widget shows latest quotes, a simple chart and key fundamental fields for a single stock. It’s in-depth, yet detailed, and it’s a great solution for web and mobile. You can add multiple tabs to cover several stocks and use a “Chart Only” mode for a simpler look.
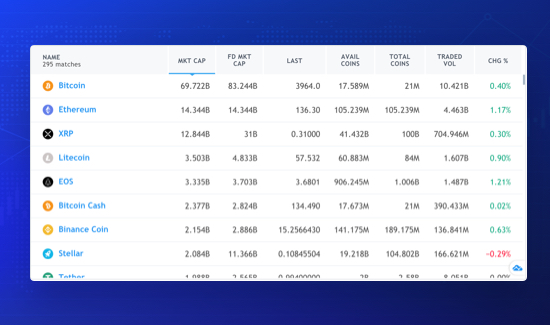
Supports Cryptocurrency Chart
Cryptocurrency Market Widget is our latest tool for crypto traders and enthusiasts. This widget displays most of the available crypto assets and sorts them based on the market capitalization. The key metrics such as the closing price, total and available number of coins, traded volume and price change percentage are all available at a quick glance.
