JA Google Chart Module Introduction
Quick Info
- Updated on:22 Jan, 2024
- Version:1.2.0 Changelog
- Download:12,091
JA Google Chart is free Responsive Joomla extension for Joomla 3 to build responsive Google Charts based on the available data imported manually or from a CSV files and even Google spreadsheets. This Joomla extension supports up to 11 common cool chart types, and its powerful admin panel and chart preview enable you to customize your charts with ease. The module uses the Google Visualization API.
- Joomla 3 native
- Responsive
- Supports 11 chart types
- Chart preview
- 3 ways to input data: manual, CSV import or via Google Speadsheet CSV url
- Configurable Axis: horizontal and vertical
- 3D view for Pie charts
- 3 Display modes for GEO Chart
Main Features
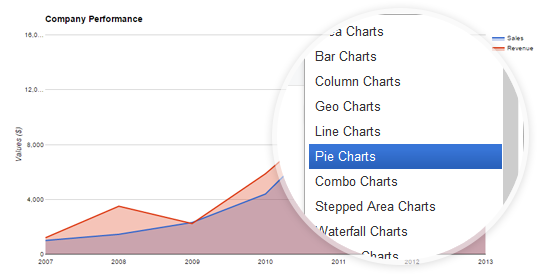
Support 11 chart types
The responsive Joomla module comes with 11 commonly used chart types: Area, Line, Column, Geo, Pie, Bar chart, etc. Each chart has specific settings.
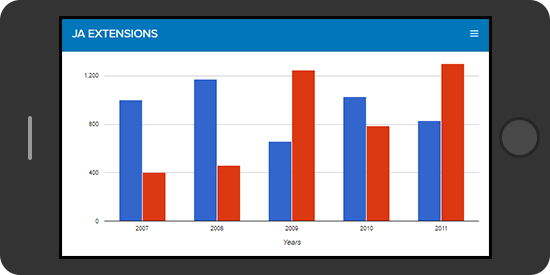
Fully responsive
No matter what size your screen size is, the module will remain stunning. If you don't want it to be responsive, you can always fix the module width size.
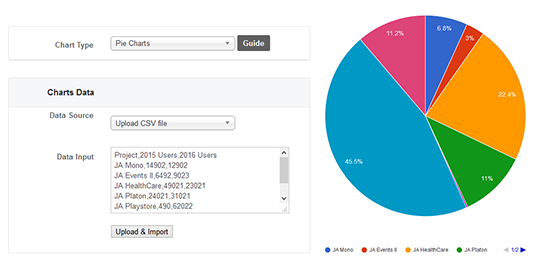
Chart preview
Configure the Google charts your way with preview panel in the back-end. What you configure will be previewed in the panel in real time.
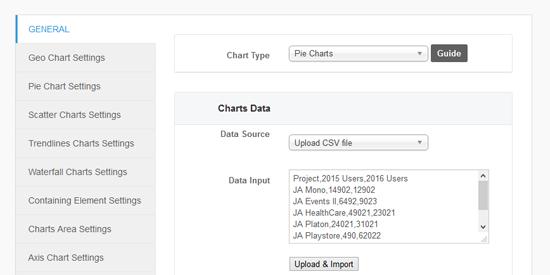
Intuitive configuration panel
Since Google charts have many settings and options, the admin panel is organized in smart ways to be easy for user to configure. Settings are devided into groups based on its functionility.
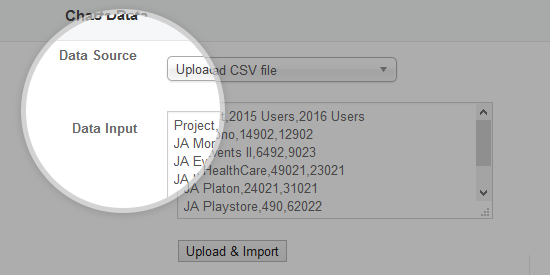
Multiple data sources supported
You can add data directly in the Data Input field or import it using a CSV file or directly from a Google Spreadsheet using the Google Speadsheet CSV url.
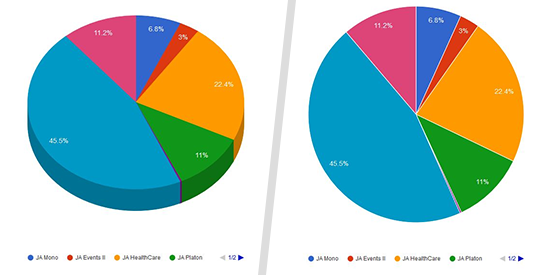
2D or 3D view for Pie Chart
For Pie Chart alone, you can display in either 2D or 3D. All you have to do is Enable or Disable the "3D chart" option in the back-end.
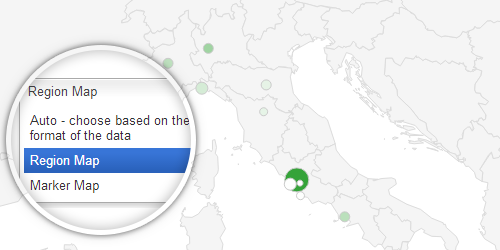
Geo Chart supports 3 display modes
You will be able to get any type of data format display different depending on your preferences with these 3 display modes supported.
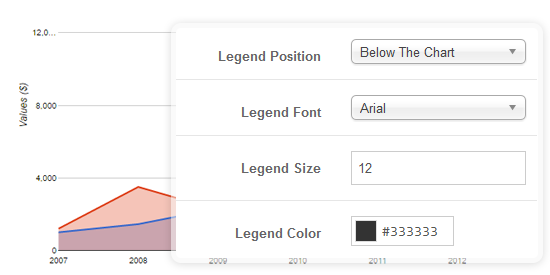
Font, color, tooltip settings
For almost each element in your chart: title, legend, axis, etc. you have full control in term of color and font settings (font family and font size). Get creative and go bold.
