GoogleChart integration not working with JA Google Charts Module

- Edited
Well, if you're talking about this sample data, I just can't: The web share feature isn't enabled, so I can't get the URL in CSV format. Or did you mean another data URL I maybe didn't see in the documentation?
And as I said: Your documentation seems to be outdated (yes, we all love this surprising "monthly improvement policy" of Google... ;-)). However, the Google tables share window doesn't look anymore as it is in your documentation.
The "live demo" button doesn't work neither (Chrome & Firefox on Mac), btw.
thank you.
some more analysis:
I adapted the CSV-URL from your example by expanding the sheet ID with the parameters and the URL prefixes in the screen shots. And then it worked (although it didn't use the pie chart but just the very first table): https://docs.google.com/spreadsheet/pub?key=10JQZob-lWt0GSWcOvKgw9JwZbvkGGlXn3dq2sUEQUBU&single=true&gid=1&output=csv
BUT (and this is more important): We can't get this to work with the new google tables. The reason is, Google obviously changed its URL format for CSV sharing. Now the sharing URL for CSV output looks like
https://docs.google.com/spreadsheets/d/e/2PACX-1vR3HjEvTe8oqS1gmLfigr7LFHRTtuYk3OauRcgXlrWhxkVsEpMPK-Pviibg33So-yD73y1N_3PBPZHt/pub?gid=0&single=true&output=csv (not working sample URL).
If I copy one of those new share links into your module I get the error "JA_GOOGLE_CHART_MISSING_DATA_INPUT" in the frontend.
So it seems like it is all about updating the module (and the documentation, please) to comply with the new Google API requirements.
What do you think, how fast can this be done?
Thank you!
Hi seppali
Yes, the URL seems to be changed but when I published, the URL should be:
I add this URL to 'TEST Chart (2)' module on your site and try to assign it to 'content-top' position and it shows fine: https://prnt.sc/pivxfw (I temporarily disabled this module, you can enable again to see the same)
Hi, this works indeed with your link and your table, but not with mine (which actually is quite important):
Strangely, my link works like your new one (csv file is downloaded, even in a private windows, so it's no permissions issue). It must be something with the (new) spreadsheet, then. And as I mentioned several times, the Google spreadsheet web publish dialog is no more looking (working?) as in your documentation.
Thanks for your ongoing support.
S.
Hi, yes of course!
Here you are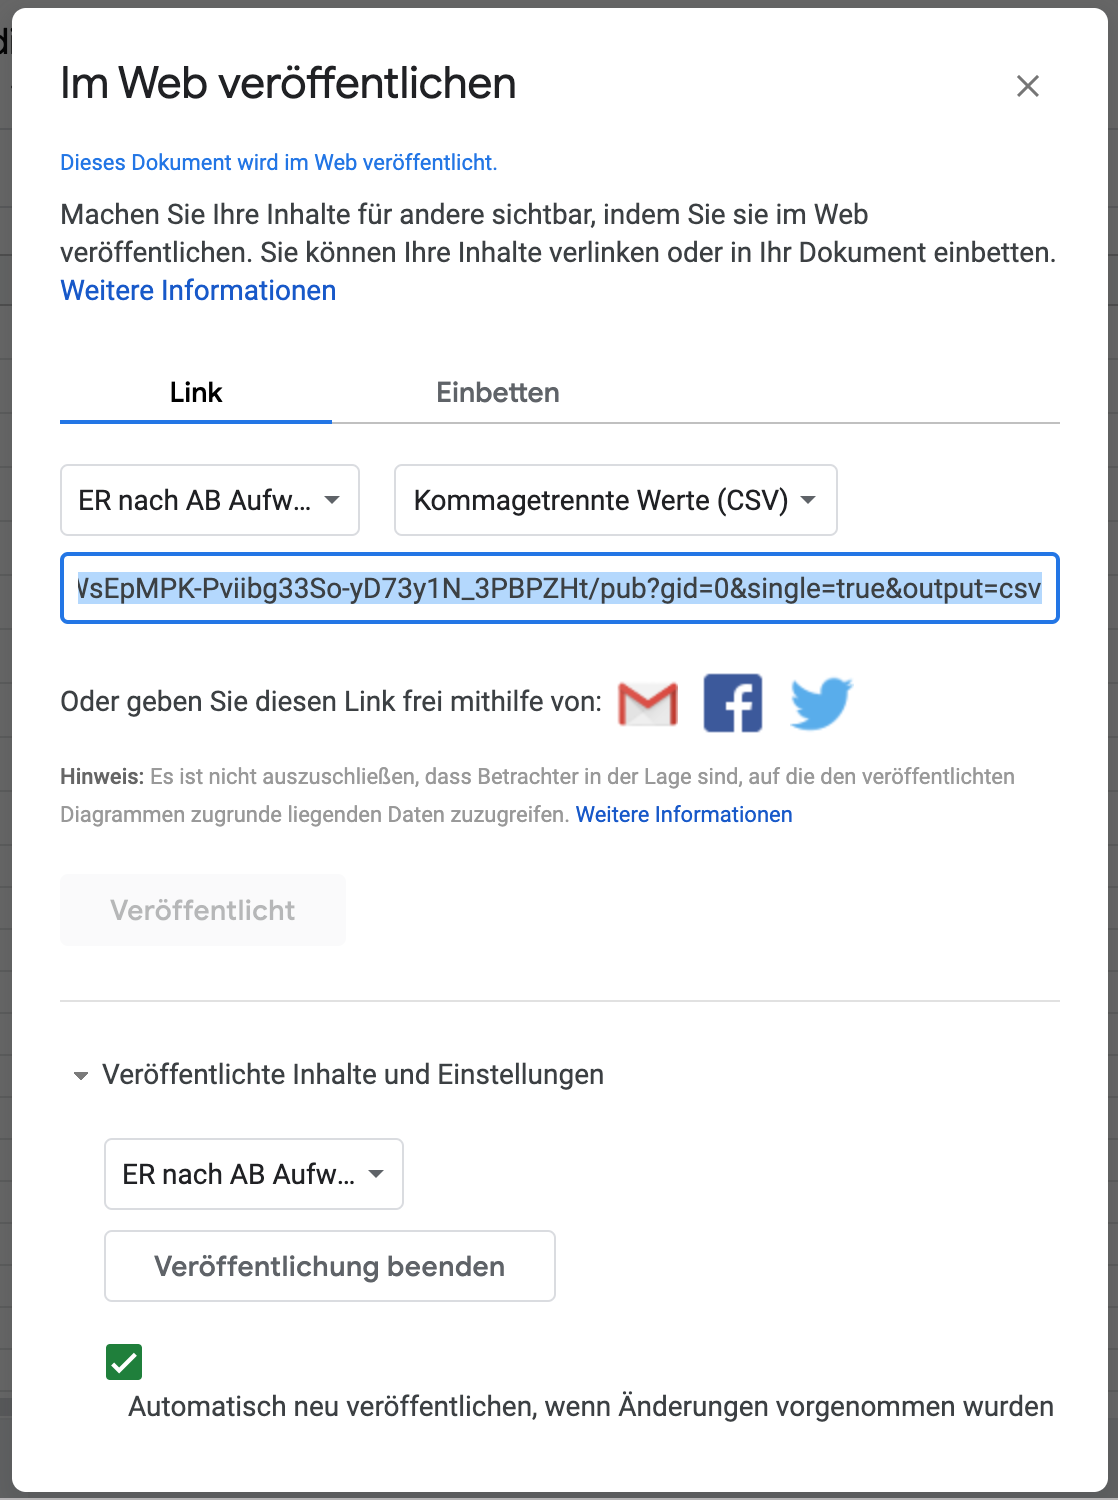
anything else we can do for you? Maybe share the table with your Google-Account (please let us know your G Suite Gmail address).
Thank you, S.
so you managed to display a chart with my link?
What if you create a complete new Google table and try with it (I'd bet, it won't work either).
What can we do (we desperately need this feature as soon as possible)?
thank you.
okay, thank you. what do you mean / need exactly?
Here we are with the table we actually need (you should have access)
https://docs.google.com/spreadsheets/d/1x8WFvcR1MkDhJNVyhL9MymQMw4sOK-uh5rR-j4RqRDk/edit?usp=sharing
Just to be clear, what we need. We want to integrate a link to this Google sheet (auto updating), not just a static download and upload of CSV file.
anything else we can provide you with?
thanks!
Hello, saguaros?
- Edited
I tested again with several cases and confirmed with the developer that there is issue here, I've reported the bug also to the dev team for fixing it.
At this moment, you can try to remove the comma under AB column in your docs so the chart can work.
Updated:
You can backup your site and install this updated package
great, thanks a lot for your efforts! I'll check this immediately and let you know about the result.
thanks again!
- Edited
Hi saguaros
I can confirm it works with the updated module: I can import the charta data now (again) from Google tables.
BUT (and maybe I didn't understand the feature well), it does not automatically update: When I change the date in Google tables, the chart is not automatically updated.
Is this feature even provided? And if not, is it a big thing to include this feature?
The second question is about taking control of the elements of the chart. Is it possible to persistantly display the tooltips (with the name and the values)? Can we influence the format of the legend (display on two lines instead of the scrolling feature with the blue arrows)?
thank you!
great, good to know! thank you!
what about my other question?
The second question is about taking control of the elements of the chart. Is it possible to persistantly display the tooltips (with the name and the values)? Can we influence the format of the legend (display on two lines instead of the scrolling feature with the blue arrows)?
thanks!