GoogleChart integration not working with JA Google Charts Module

so you managed to display a chart with my link?
What if you create a complete new Google table and try with it (I'd bet, it won't work either).
What can we do (we desperately need this feature as soon as possible)?
thank you.
okay, thank you. what do you mean / need exactly?
Here we are with the table we actually need (you should have access)
https://docs.google.com/spreadsheets/d/1x8WFvcR1MkDhJNVyhL9MymQMw4sOK-uh5rR-j4RqRDk/edit?usp=sharing
Just to be clear, what we need. We want to integrate a link to this Google sheet (auto updating), not just a static download and upload of CSV file.
anything else we can provide you with?
thanks!
Hello, saguaros?
- Edited
I tested again with several cases and confirmed with the developer that there is issue here, I've reported the bug also to the dev team for fixing it.
At this moment, you can try to remove the comma under AB column in your docs so the chart can work.
Updated:
You can backup your site and install this updated package
great, thanks a lot for your efforts! I'll check this immediately and let you know about the result.
thanks again!
- Edited
Hi saguaros
I can confirm it works with the updated module: I can import the charta data now (again) from Google tables.
BUT (and maybe I didn't understand the feature well), it does not automatically update: When I change the date in Google tables, the chart is not automatically updated.
Is this feature even provided? And if not, is it a big thing to include this feature?
The second question is about taking control of the elements of the chart. Is it possible to persistantly display the tooltips (with the name and the values)? Can we influence the format of the legend (display on two lines instead of the scrolling feature with the blue arrows)?
thank you!
great, good to know! thank you!
what about my other question?
The second question is about taking control of the elements of the chart. Is it possible to persistantly display the tooltips (with the name and the values)? Can we influence the format of the legend (display on two lines instead of the scrolling feature with the blue arrows)?
thanks!
- Edited
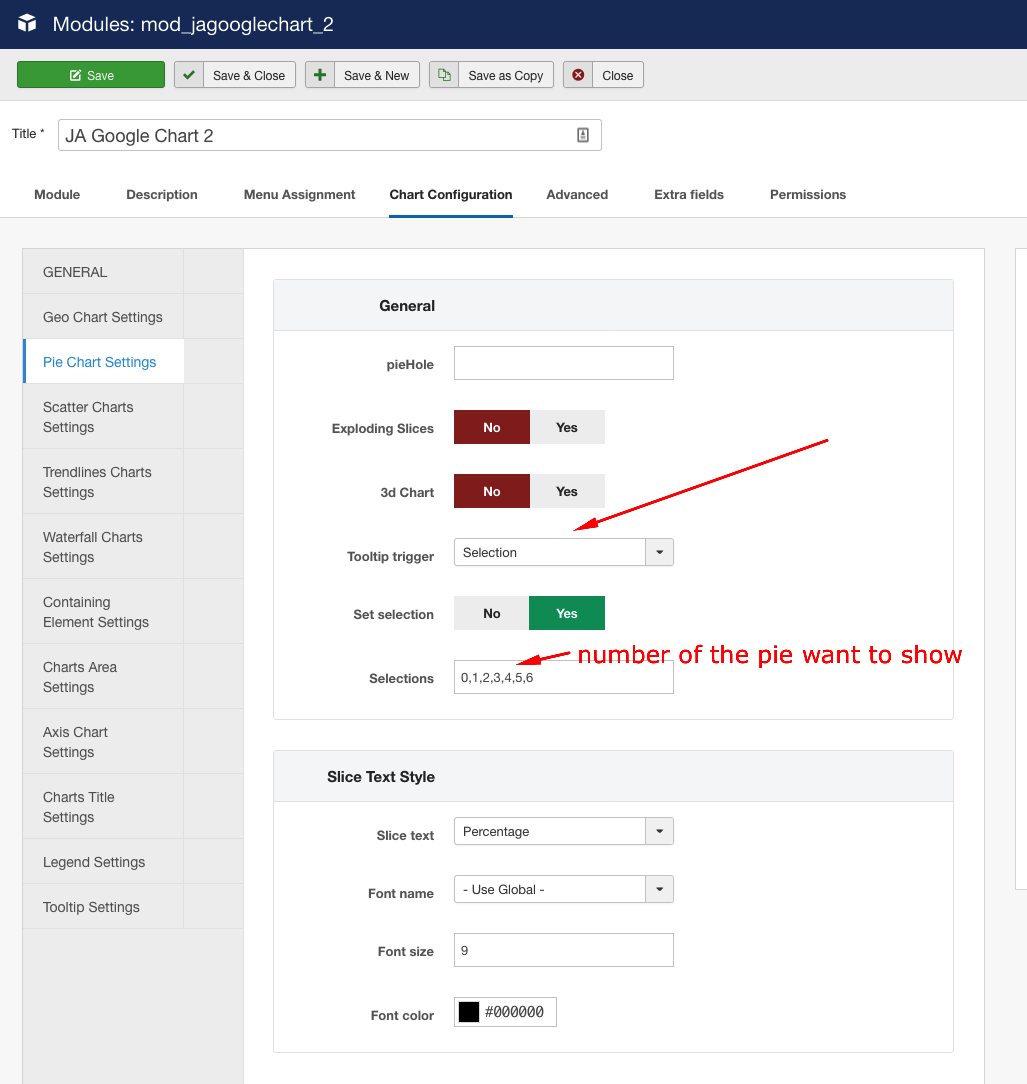
seppali Is it possible to persistantly display the tooltips (with the name and the values)?
Google chart supports to show 1 tooltip only, like this: https://jsfiddle.net/svgcey72/
only pie chart can have: http://jsfiddle.net/uxr1qbt0/
Hi saguaros
Yes, this (http://jsfiddle.net/uxr1qbt0/) is exactly what I'm talking about. Right now, this tooltip only shows up, when I hover the segments of the pie chart (what is - of course - the purpose of a tooltip).
But we would like to show this info permanently, not only on hover (because we need it also in "print" / PDF). So if there would be a checkbox "show tooltips permanently" (or option field: tooltips: "on hover" | "permanently"), this would be absolutely great.
Do you know what I mean?
Thanks!
cool! pie chart is absolutely great! Looking forward to this.
Thanks a lot for your awesome support!